


Understanding RSI and PEG
1. Relative Strength Index (RSI)
- A technical indicator that measures the speed and magnitude of price changes to identify overbought or oversold conditions.
- RSI ranges from 0 to 100:
- Overbought: RSI > 70 (stock may be overvalued and due for a correction).
- Oversold: RSI < 30 (stock may be undervalued and primed for a rebound).
2. Price/Earnings-to-Growth (PEG) Ratio
- A fundamental valuation metric that evaluates a stock’s P/E ratio relative to its earnings growth rate.
- Formula:
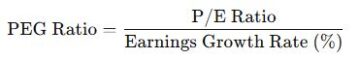
- Interpreting PEG:
- PEG < 1: Undervalued (good buying opportunity).
- PEG = 1: Fairly valued.
- PEG > 1: Overvalued.
The RSI & PEG Strategy
This strategy uses the RSI to identify short-term buying opportunities in fundamentally strong stocks identified by the PEG ratio. The approach works best in volatile or trending markets.
Example: Using RSI & PEG Strategy
Stock: ABC Corp.
- P/E Ratio: 15
- Earnings Growth Rate: 20%
- PEG Ratio: 15/20=0.75 (undervalued)
- RSI: 28 (oversold condition)
Action:
- Buy ABC Corp., as it has strong fundamentals (PEG < 1) and is oversold (RSI < 30).
- Target exit when RSI exceeds 70 or PEG rises above 1.2.
Benefits of RSI & PEG Strategy
Combines Technical and Fundamental Analysis:
- PEG ensures the stock is fundamentally sound.
- RSI identifies optimal timing for entry.
Reduces Risk:
- PEG ensures you’re not overpaying for growth.
- RSI minimizes the chance of buying during a downtrend.
Works in Volatile Markets:
- RSI detects short-term sentiment shifts, ideal for trading in choppy markets.
Best Practices
Combine with Other Indicators:
- Use RSI and PEG alongside volume analysis, support/resistance levels, or moving averages for confirmation.
Diversify Across Sectors:
- Avoid concentration in one industry; some sectors (e.g., tech) tend to show lower PEG ratios.