The financial markets – what’s occurring
Again, the main Theme is how will the US stock markets perform without the Monetary and Fiscal policy assistance. Europe are getting in on the act as Inflation fighters; halting the financial support and threatening rate rises later this year.
The Economy, if the US employment figures on Friday are any guide, is going well. The employment nos for 2021 were revised upwards.
It looks like the economy does NOT need any more support and will thrive. This should be good for co sales and earnings……hence share price.
Earnings season is a seriously busy time, and one needs to focus. Amazon, Google and Microsoft had good results and guidance and their share price prospered. Facebook on the other hand – 26% fall!!!!
Markets tend to settle down after earnings season and plod higher.
The technical analysis issues are – did the recent sell off reach a crescendo? Has the low been put in? The countertrend, short covering rally, failed at the 68% Fibonacci level and the sell off from there looked technically bad.
However, we look to have regained the 200 dma.
AS USUAL, MIXED MESSAGES.
Inflation
CPI in the US will be released Thursday.
Fed watch
The good employment nos should allow them to continue of their tightening path when they meet again in early March
Bonds
Yields hit recent highs on Friday.
All assets/risk are valued in relation to Bond yields imho therefore risk assets have to fall in price.
Economic news due PMIs for January due. Friday see the Employment report. https://www.investing.com/economic-calendar/
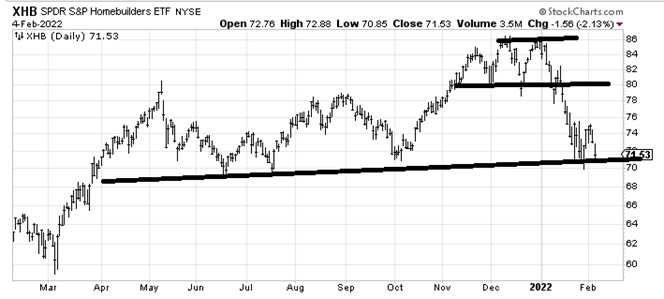
30y mortgage rates in the US just hit 3.85%: that’s 1pp higher vs Feb 2021.
Likely to cause Housing to slow down.
Earnings season’s big week is behind us.
Stock market
Overvaluations caused by easy monetary and fiscal policy will ease as the two economic policies are withdrawn
Earnings and outlook were confirmed as the most important guide to share price.
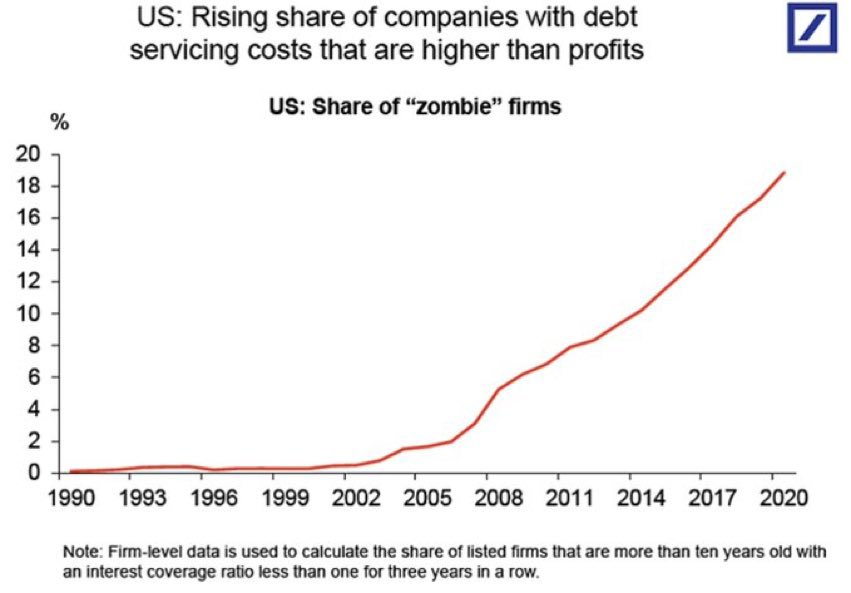
How rate rises hurt weak corporations——
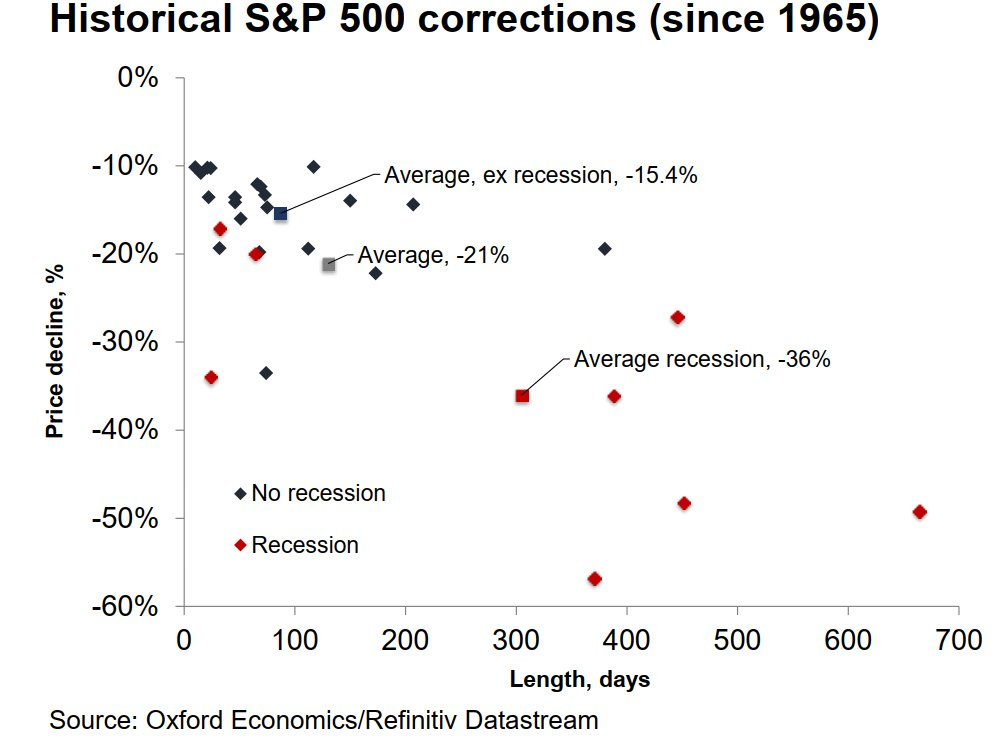
Correction Map: “average S&P 500 pullback during non-recessionary periods is -15.4% and -36% during recessions” S&P500 correction was ~12% high-to-low, about in line with average ex-recession… (but what if a recession is coming )
Technical Analysis
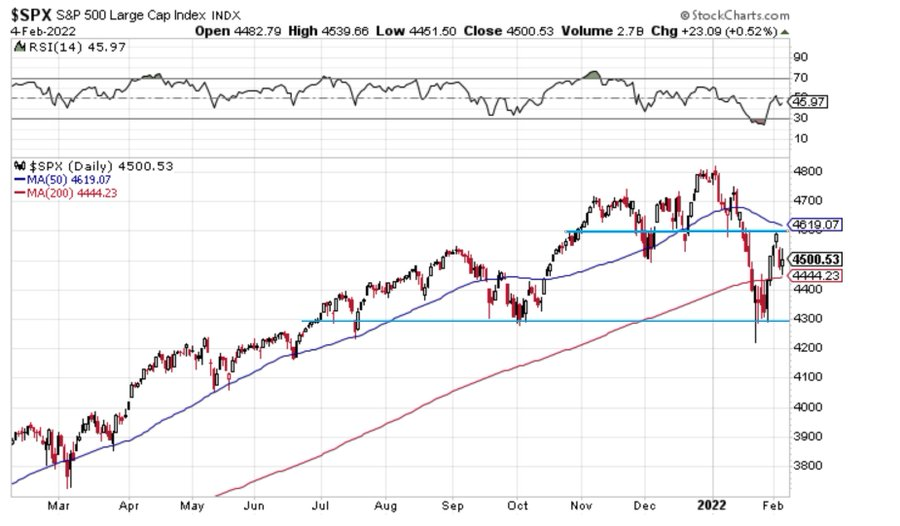
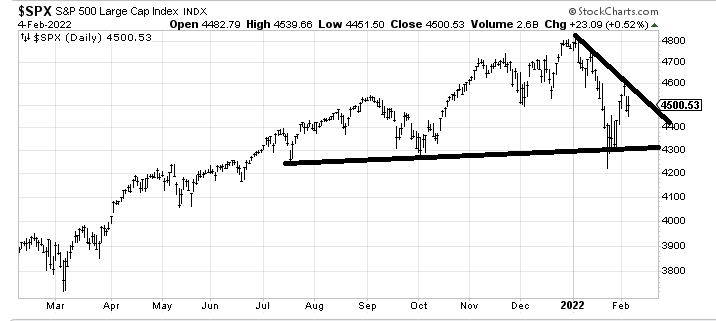
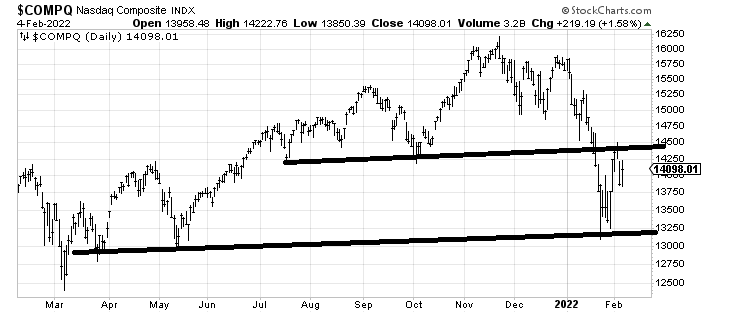
S&P500 sandwiched between support & resistance AND the 50dma & 200dma
My chart guy said
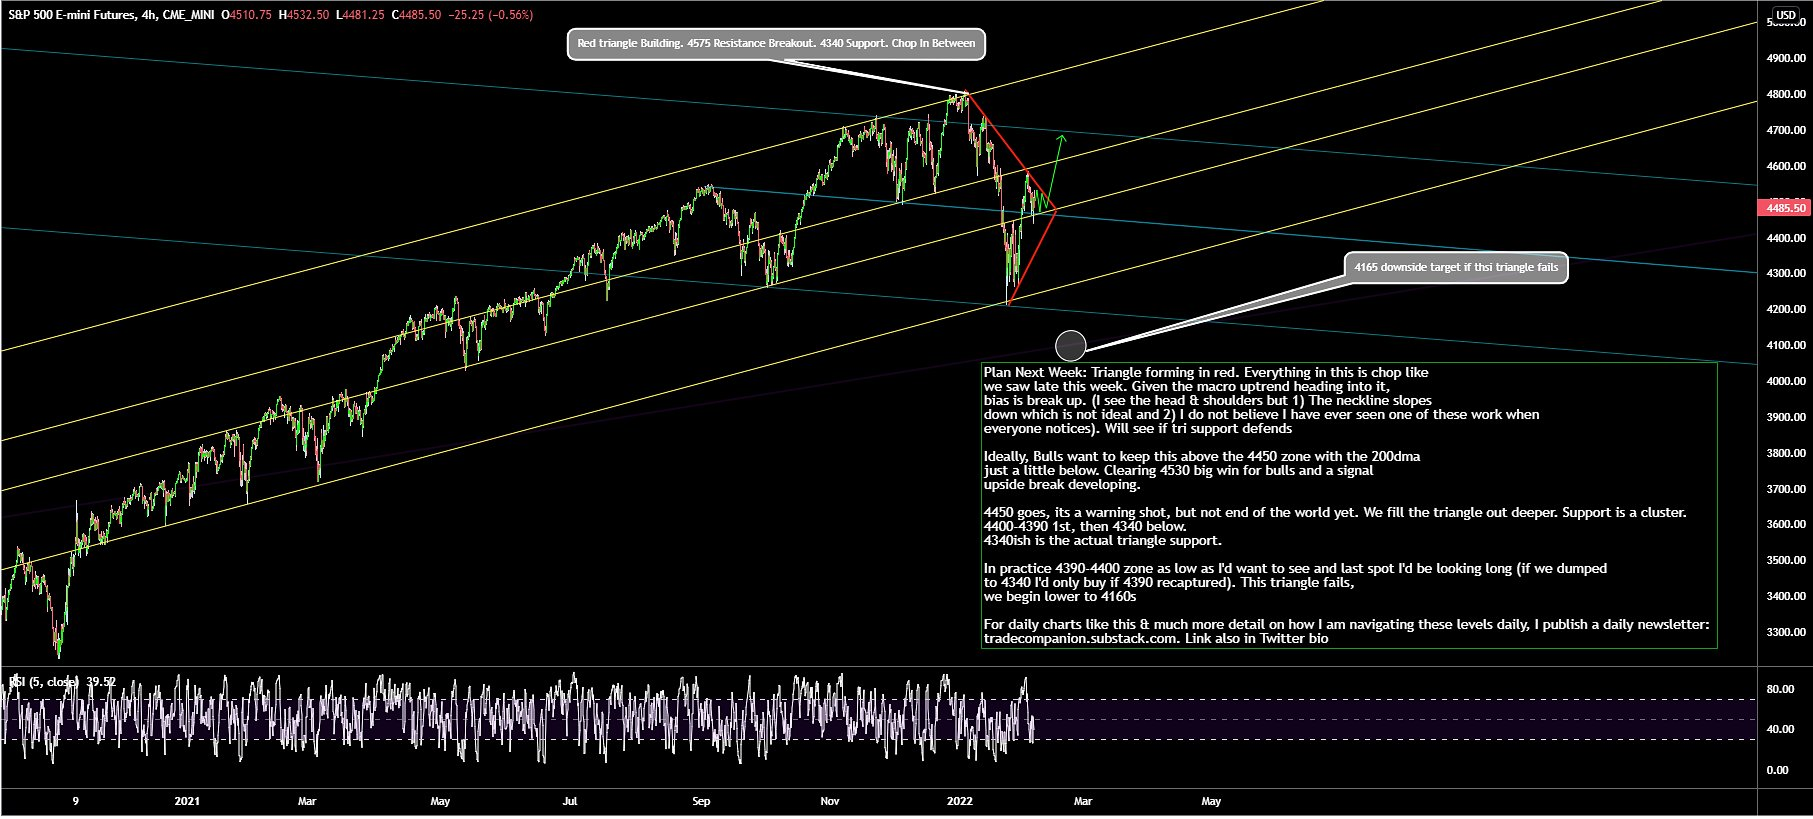
Good & bad news for #ES_F bulls. Good news: Big triangle forming that favors break up. Bad news: Likely fills out (chop) more 1st Plan: Chop above 4450 sets up direct break to 4690+. 4450 fails, we see 4390-4400 triangle support 1st (must hold or new lows)
Something for the Bulls
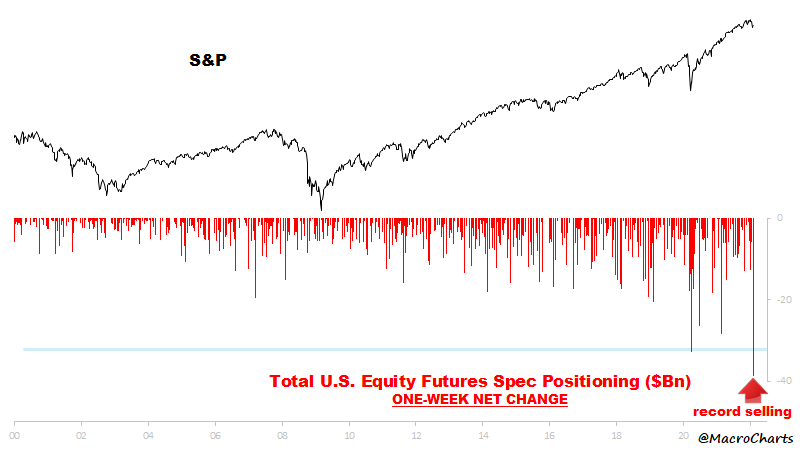
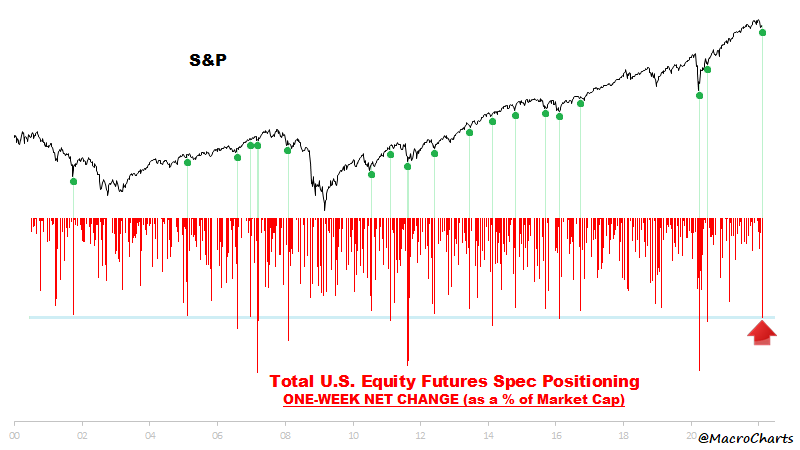
Equity traders have cut exposure at the fastest rate in history. The one-week positioning change is at a new record low – worse than the MARCH 2020 bottom. Relative to Market Cap, the selling is also among the worst in history – previously seen at some Major market bottoms.
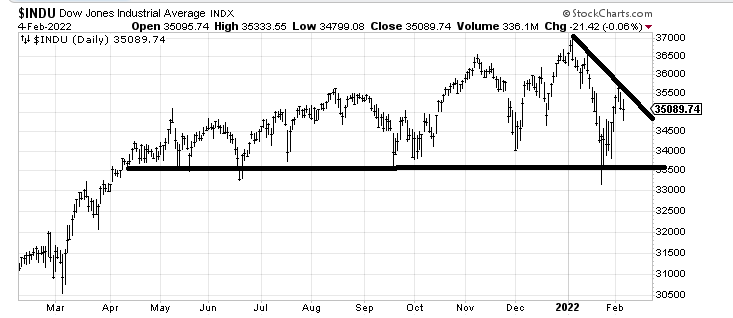
Support lines held last week. But so did resistance.
Conclusion
Watch the price – failure at resitance will see rapid declines again.
It is a short term game. I am flat and only playing when Time and price action show momentum. Join the tide!!!
Watch your risk, join momentum moves……
Call or email for discussion.
Colin 01-6644034 0851722729
